
August 2009 Vol. 236 No. 8
Features
Software Uses GIS Data To Identify High-Consequence Areas Along Pipelines
PetroChina Pipeline Company’s R&D Center has developed software for the efficient and accurate calculation of high-consequence areas (HCAs) along a natural gas or petroleum liquids pipeline route.
Based on ArcGIS Pipeline Data Model (APDM), the software uses the ArcGIS linear reference method. Once the facility and environmental data are stored in an Oracle database, HCA-affected pipeline segments can be located with the software developed to perform this spatial analysis.
The company used this software to determine the HCAs along the 1,200-km Lanzhou-Chengdu-Chongqing Oil Pipeline for refined products. The primary consequence factors were determined to be: 1) high population density; 2) rivers; and 3) roads. Several steps were followed by the software. They are: 1) data gathering; 2) data integration; 3) class location analysis; and 4) sensitive areas analysis. All the above steps were accomplished by the software. Threat identification for HCA segments was completed by field surveys. The software reduces the manual effort pipeline operators must expend to determine and manage HCA locations. This minimizes the need for costly direct assessments of pipe.
HCA™ Software
The software is designed to work as a standalone application linked to a data base. It is built to be configured to work on customized APDM models. Used in conjunction with APDM data, the software assists pipeline operators in meeting regulatory compliance, enabling rapid and accurate calculating affected segments of pipe along both gas transmission pipelines and hazardous liquid pipelines.
The software mainly consists of three modules: 1) Class Location Analysis, 2) HCATM for Gas Pipelines and 3) HCATM for Liquid Pipelines. In addition, some auxiliary management tools are included in the software, such as a dynamic project tool, analysis setting tool, data quality check tool, data upload and download tool, data view and query tool, and export tool. It is convenient for users to deal with data by these management tools. If the data is stored in a remote data base such as Oracle, the software also supplies a tool to download the required data for HCA analysis from Oracle. Moreover, a tool for uploading the result of analysis to the remote data base is included in the software.
The Class Location Analysis Module classifies pipeline segments according to Chinese-related rules, GB 50251-2003, Code for design of oil transportation pipeline engineering. The definition of classes in GB 50251-2003 is given in Table 1.

Table 1: The Definition Of Classes In GB 50251-2003.
In Table 1, a class location unit is an area that extends 200 meters on either side of the centerline of any continuous 2-kilometer length of the pipeline.
To automatically calculate classes by computer, we have developed an algorithm according to our rules. Using the algorithm, the class location of a pipeline segment is determined automatically by the density of inhabited or publicly used structures nearby. The classes range from 1 to 4.
In the analysis of class location, the threshold value of the number of buildings with four or more stories is determined by users. The default value is 100. If the box in the window’s form of class location analysis is checked by the user, the result of analysis is automatically stored in the local geospatial data base. Otherwise, the result of analysis isn’t stored as any format.
Gas Pipelines Module
Except for Class 3 areas and Class 4 areas, the analysis includes Potential Impact Zone Analysis. Identified site where people are mobility-impaired, confined or hard to execute, and gather for recreational and other purposes, is mainly considered in Potential Impact Zone Analysis.
First, the HCATM for gas lines constructs a buffer along the pipeline, with the buffer size identified by the C-FER formula or a specified distance. Then the software performs the Class Location Analysis and Potential Impact Zone Analysis. In Potential Impact Zone Analysis, a circle is constructed around identified site. By the spatial relationship, the pipeline layer is intersected with the circle layer. Using linear reference, the result of HCA analysis with begin and end stations, which is ArcGIS polyline feature class, is stored in local geospatial data base.
Liquid Lines Module
Many more factors are considered in HCA for liquid lines than gas lines. Along with population and environmentally sensitive areas, major traffic areas are included in the analysis. The major traffic is highways, national roadways, state roadways, railroads, and navigable waterways. Environmentally sensitive areas included are waterways, explosive industrials and warehouses, foreign pipelines, and underground electric and high voltage lines, etc.
The result of HCA with station measures are derived to indicate the pipeline segments that could affect the HCA. And it is stored in the local geospatial data base as ArcGIS polyline feature class.
The Lanzhou-Chengdu-Chongqing Pipeline for refined products was commissioned some years ago. Several primary steps were followed in the analysis for the pipeline:
- Data gathering (data sources),
- Data integration,
- Class location analysis,
- Sensitive areas analysis, and
- Threat identification.

Figure 1: A flow chart for the HCA analysis of the Lanzhou-Chengdu-Chongqing pipeline.
Data Sources And Quality
By field survey and vectorization, the spatial data of pipeline centerline and landbase are gathered. The land base consists of lines and polygons data incorporating waterways, explosive industrial, major traffic, the third-party pipelines, and ecological areas, and has degrees of mapping accuracy with scales of 1:50,000. The projection of data is Gauss-Kruger projection. Figure 2 depicts the initial 5,500-meter pipeline from the Lanzhou tank farm with the land base data extending 1,000 meters on either side of the centerline. The red line represents Lanzhou-Chengdu-Chongqing Pipeline, the yellow vector layer represents buildings, the black line layer represents railroads, and the blue line layer represents rivers. Moreover, there is a famous river called Yellow River in northeast of the figure and it is vectorized as a polygon layer. The image is Quickbird with the resolution of 0.61m.
Figure 2: The land base data for the initial 5,500-meters of the pipeline.
All of the data (centerline data and land base data) are integrated to form a geospatial data base that follow APDM rules. They are saved as vector layers in a geospatial data base (ESRI Personal Geodatabase).
Based on the density of inhabited or publicly used structures nearby, the class location tool classifies pipeline segments into four classes: 30 Class 4 locations and 129 Class 3 locations are determined by the class location tool. The length of Class 4 and Class 3 locations is about 315 km, which accounts for nearly 25% of the total length of the pipeline.
Figure 3: An example of a Class 4 location on the pipeline in the county of KangXian.
Figure 3 depicts an example of the Class 4 location due to high population. The polygon vector layer represents buildings. The red line represents the Class 4 location of a pipeline segment crossing the county of KangXian. The class location tool automatically calculates the begin-station value of 444.718 km and the end-station value of 446.718 km.
Sensitive Areas Analysis
The U.S. Office of Pipeline Safety (now part of PHMSA) defines unusually sensitive areas (USAs) as places that contain drinking water and ecological resources that are potentially more susceptible to long-term, irreversible, or irretrievable damage from a pipeline accident. Freeman, B., in a 2002 paper mentioned at the end of this article, divided USAs into two categories: “Drinking Water USAs” and “Ecological Resources.” Actually, several primary factors were considered in an analysis of the sensitive areas of the Lanzhou-Chengdu-Chongqing Pipeline. They were major traffic, such as railroads, highways, national ways and state ways; rivers, reservoirs and lakes; high-voltage lines and underground power lines; explosive industrials and warehouses; and third-party foreign pipelines.

Figure 4. A high-consequence area segment in sensitive areas.
Figure 4 shows a HCA segment identified by the HCATM software. From the figure, we can clearly see that the Tao River and some high-voltage lines are the primary factors of HCA. The “begin-station” value of 44.961 km and the “end-station” value of 47.067 km are also calculated by the software.
Threat Identification
The new integrity regulations will require operators to perform integrity assessments and accompanying mitigative treatments to threatened pipeline segments in HCA areas. By field survey, two primary types of threats are determined – third-party damage and geohazards.
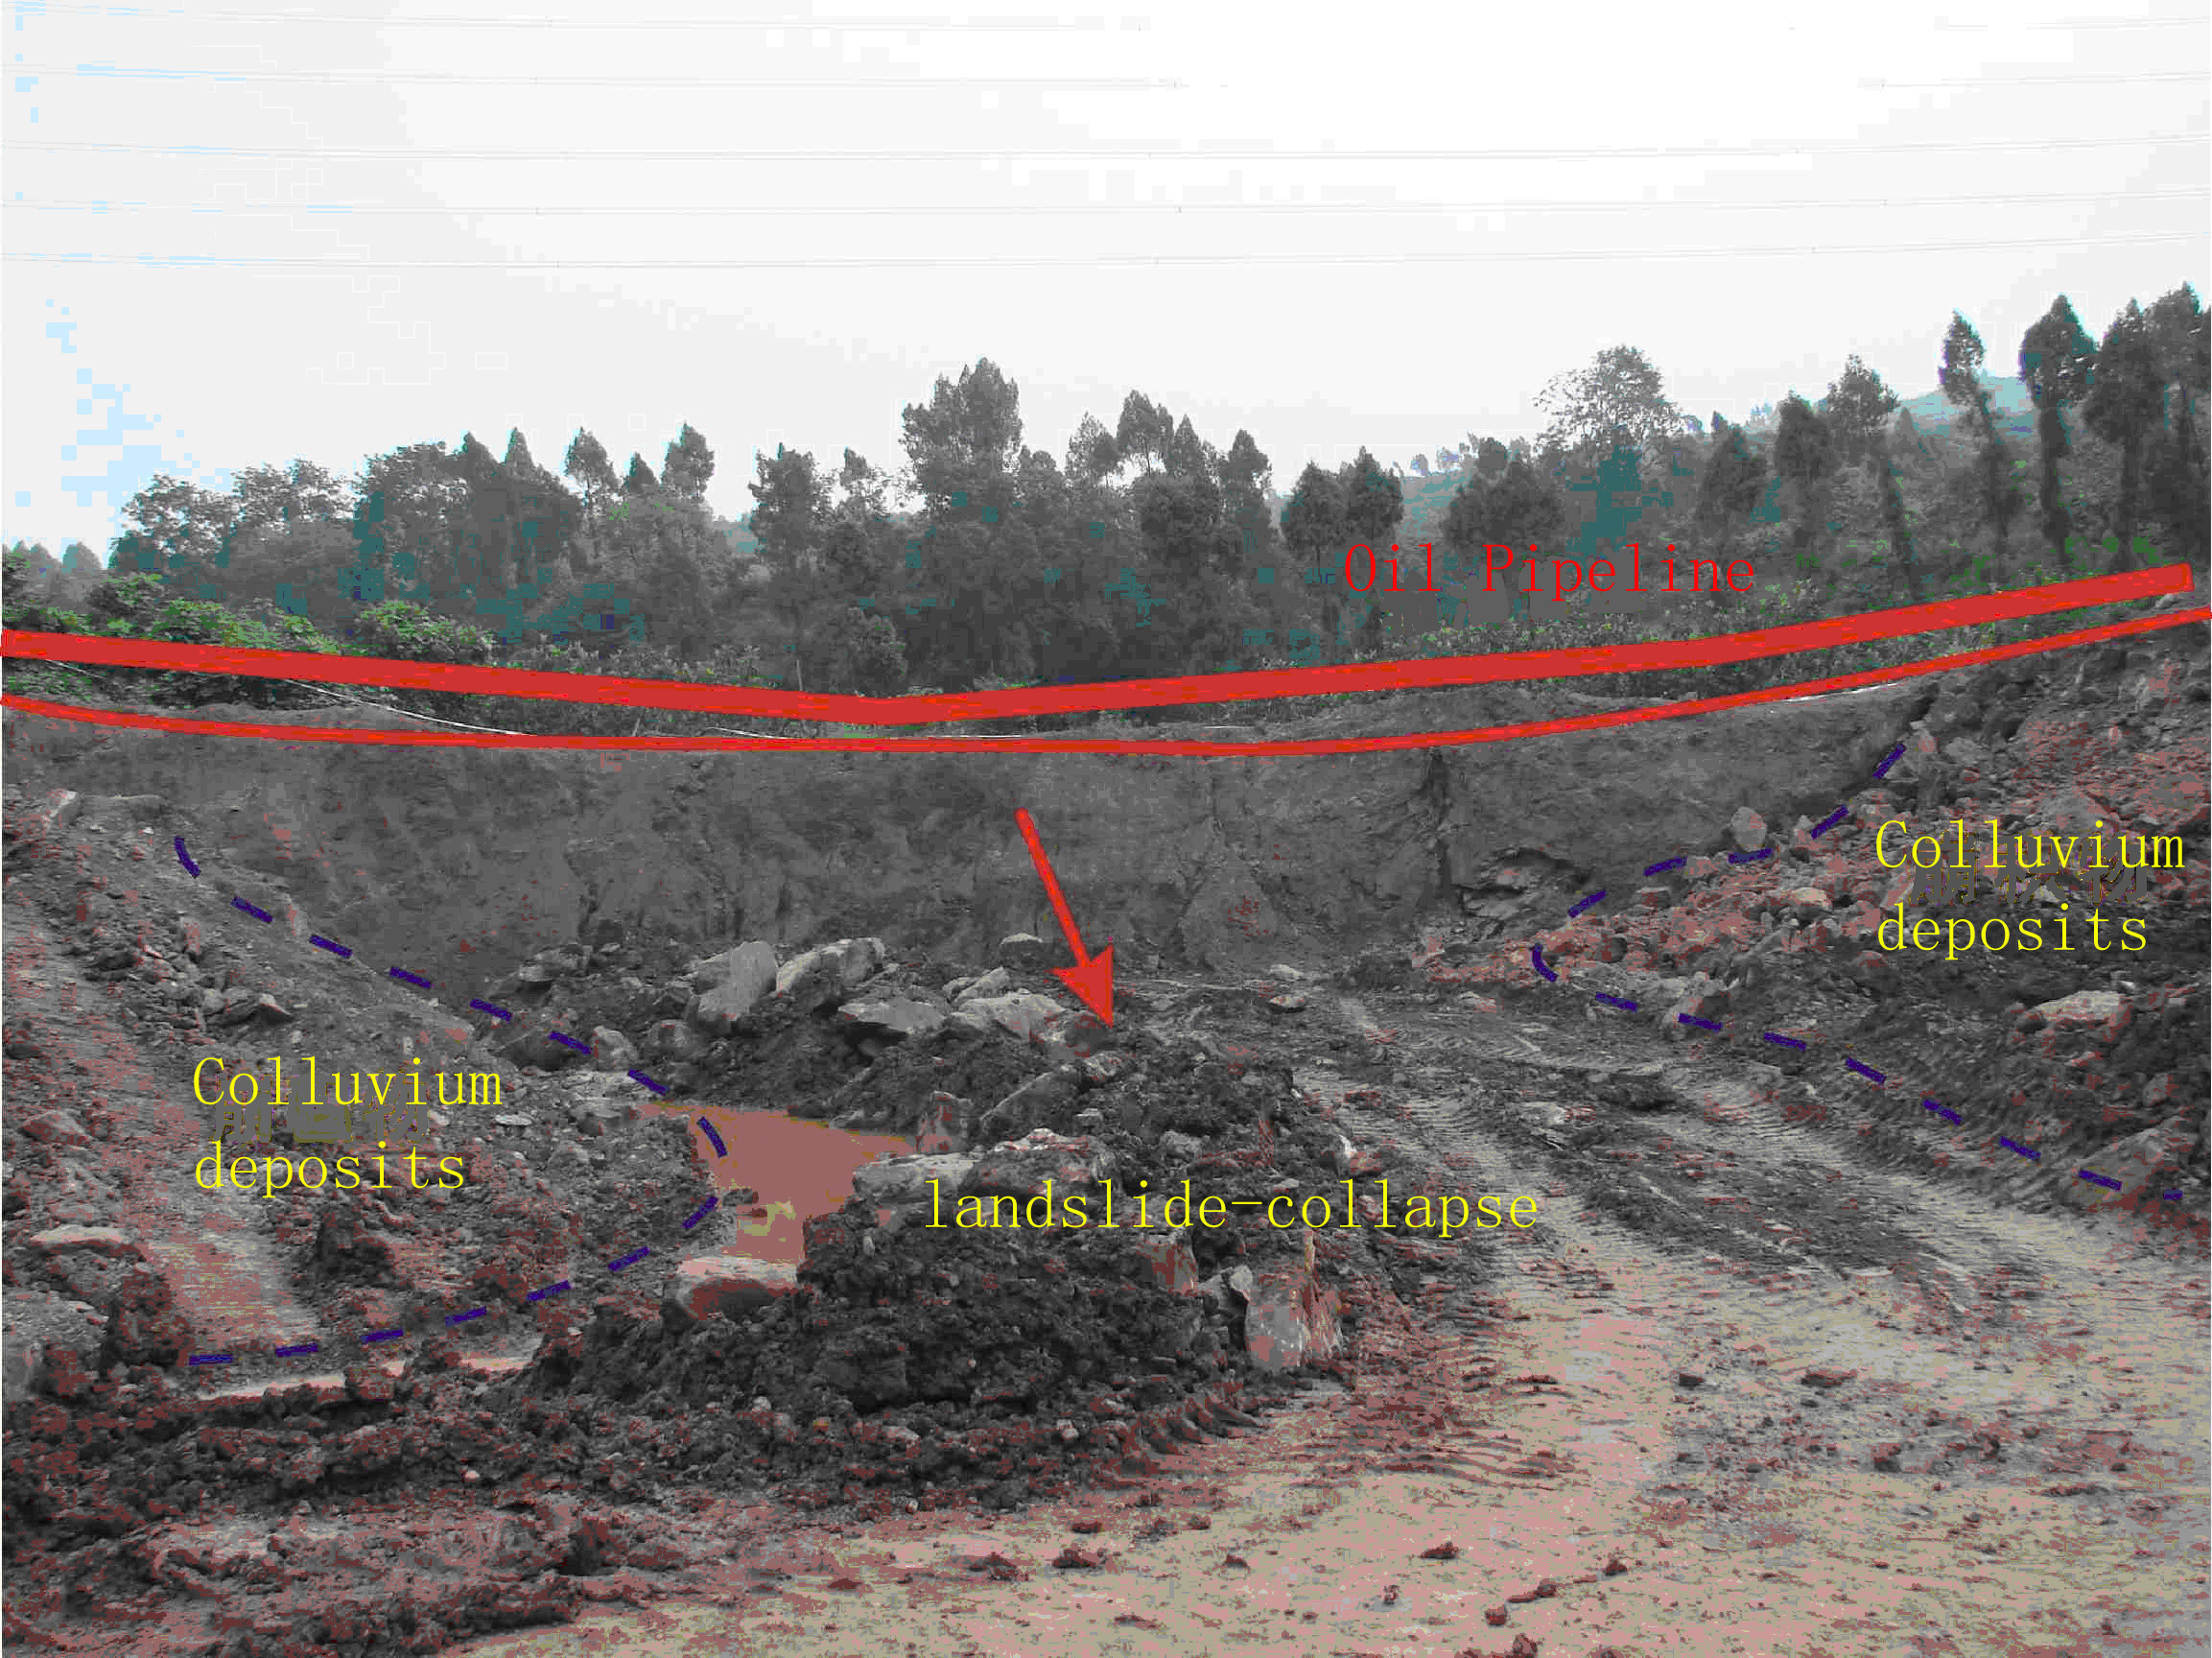
Fifteen geohazard sites were identified in HCA areas in 2005. For these pipeline segments threatened by the geohazards, we must conduct additional preventive measures: increasing patrols, adding external protection, reducing external stress and relocating the line. Figure 5 shows a landslide-collapse in Longquanyi District of the city of ChengDu. Based on the threats identified within each HCA segment, we can further determine the best method of assessment.
Conclusion
The HCA™ software provides a set of comprehensive and useful tools that can improve efficiency and accuracy of operators during the high-consequence area analysis. With the HCATM software, all HCA segments with scores are calculated.
Figure 6: Graph of high-consequence area (HCA) scores of the Lanzhou-Chengdu-Chongqing Oil Pipeline.
The total length of 848.7 km was identified as HCA segments by the software, accounting for 68.8% of the full pipeline. Figure 6 shows an HCA graph of the Lanzhou-Chengdu-Chongqing Oil Pipeline. The x-axis shows station measures of HCA segments, and the y-axis shows the scores of HCA segments. According to results of the analysis, we find three key consequence factors: 1) high population, 2) rivers, and 3) roads. In order to provide the most appropriate protection/mitigation for the identified HCA segments, we put forward some primary proposals as follows:
- For the segments deemed HCA due to high population, set up warning signs, increase public information regarding emergency evacuation procedures, and perform additional training in response procedures;
- For the HCA segments due to rivers and lakes, increase the depth if pipe depth of cover is insufficient;
- For the HCA segments due to railroads, highways, national ways and state ways, enhancing the capability of casing inspection;
- Repairing the defects of HCA segments in time;
- Monitoring each existing and potential geohazard (e.g. landslide), and increasing patrols;
- Monitoring excavations near the pipeline. And if finding unreported excavation work, operators must conduct follow-up investigation regarding mechanical damage;
- Developing risk assessment in all HCA segments; and finally
- We determined that the reassessment interval for each HCA should not exceed two years.
Acknowledgments
The authors would like to thank their colleague, Yi Li of Pipeline Integrity Engineer, for his contribution to APDM database, and also thank LanChengYu Oil Pipeline Company.
The lead author, Shaohui Jia, is an engineer with a master’s degree in petroleum engineering and GIS. His research includes work in GIS database and HCA applications. He also has three years of experiences in the GIS application of the identification of HCAs. He can be reached at jiashaohui@petrochina.com.cn.
Bibliography
ESRI Inc. 2007. ArcGIS 9.2 Desktop Help. WEB Site www.esri.com < http://www.esri.com/="">.
GB50251-2003. 2003. Code for design of gas transmission pipeline engineering.
C-FER Technologies. 2000. A MODEL FOR SIZING HIGH CONSEQUENCE AREAS ASSOCIATED WITH NATURAL GAS PIPELINES. GRI-00/0189.
Federal Register. 2000. 49 CFR Parts 195.
Freeman, B., 2002. Assessing “Could Affect” High Consequence Areas with GIS. The 22nd Annual ESRI International User Conference Proceedings.

Comments