May 2009 Vol. 236 No. 5
Features
Software Model System Quantifies Corrosion In Dry Gas Pipelines

Current internal corrosion direct assessment (ICDA) methods for dry natural gas pipelines do not assess the extent of corrosion damage due to availability of water in the presence of CO2, H2S etc. That is because the assessment is a complex task beyond the scope of most present-day ICDA models. A new system aims to fill that need.
The PredictPipe™ software system is capable of performing the necessary flow modeling to identify the critical water accumulation zones in a pipeline, quantify water hold up and assess the effect of various process parameters on the potential for corrosion damage. (Author’s note: PredictPipe™ is a trademark of Honeywell International, Inc.) This software provides the necessary tools to perform ICDA, minimize cost of operating pipeline inspection programs, and develop safe pipeline operating procedures in a pro-active manner.
This software provides the functionalities of an advanced flow model and also the capabilities of a comprehensive corrosion prediction tool. It identifies water accumulation zones based on critical angle computation, calculates water holdup and accounts for water phase behavior, determines the wall shear stress and predicts potential worst-case corrosion rates for susceptible pipeline segments.
Program Interface And Functionality
The various aspects of the program, highlighting its ease of use in facilitating the application of ICDA methodology and providing pipeline operators with a broad view of the health of the pipeline, are presented in this section.
The software system provides comprehensive functionality to assist in performing effective ICDA and protect against costly pipeline failures. It is an easy-to-use graphical tool that integrates the effects of a complex set of environmental parameters based on extensive literature, data, lab testing and field experience to map potential corrosion hot spots and provide a birds eye view of the health of a pipeline system.
The program interface is shown in Figure 1. While this program uses a complex computational model for determining the corrosion rate, the ease-of-use in applying the system to obtain meaningful answers is evident. The first step in generating a consultation is to specify the production data, which is done by clicking on the production data button on the main screen. The production data in terms of gas production, total water content (higher numbers are used to simulate a water carry over), H2S mol% and CO2 mol%.
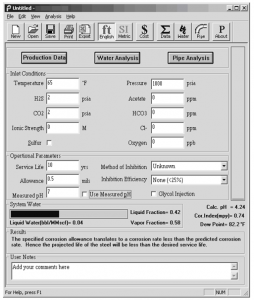
Figure 1: Program Startup Screen.
The next step is to provide ionic data for water that is carried over. This helps in computing the ionic strength and also encompasses effects of bicarbonates on pH and chlorides etc. on corrosion rates.
The import functionality enables the user to import Pipe Geometry into the program. Files of type .CSV (comma separated values) and .XLS (MS-Excel Files) can be imported. Data can be stored in the import file as distance and elevation (i.e. the absolute distance starting from point 0 and absolute elevation of each point) or as length and angle (lengths of individual segments and their angle to the horizontal). The results screen displays the overall graphical view of the piping system. Using the arrow keys to select the segment, detailed parameters about the segment can be viewed. The segment selector moves along the pipeline marking the current segment selected. The color of the selector and the angle changes to red to mark the segments with angles greater than the critical angle and hence susceptible to internal corrosion.
The system’s enhanced calculation rules for predicting the water content of natural gas and dew point calculations enable accurate predictions for water condensation and thus corrosion rates. A view of this corrosion profile provides immediate information about problem spots in the pipe system where there is a high possibility of water accumulation and potentially damaging corrosion rates.
Facilitating ICDA
Current application of ICDA methods focus heavily on determining conditions that favor formation of liquid water in a specific pipeline segment, and whether the pipeline inclination is adequate to support water carry through. Safe operation of pipelines requires the ability to either inspect or quantitatively assess the status of a line in terms of potential for failure due to internal corrosion and remaining service life.
The Advanced-ICDA framework incorporates four broad scientific technologies: fluid dynamics / flow modeling, electro-chemical characterization / corrosion prediction, current ICDA methodology and real-time corrosion monitoring. Quantitative assessment of pipeline internal corrosion, described here as part of Advanced ICDA, involves the following key steps:
(a) Perform comprehensive, rigorous thermodynamic characterization of all the pipeline segments to determine speciation, phase behavior and activities of relevant gas and liquid phase constituents.
(b) Utilize fluid flow and gas flow data to develop an accurate flow model of the pipeline and characterize the pipeline in terms of key fluid-dynamic parameters, flow regimes and liquid hold-up.
(c) Identify critical segments with water hold up and predict corrosion rate distribution across every critical segment.
(d) Use current ICDA methodology along with the knowledge of the predicted corrosion rates at the critical locations to identify locations for detailed inspection and monitoring.
(e) Monitor critical segments identified using real time monitoring sensors to provide real-time data on segment environment and performance characteristics.
The steps delineated here provide a rigorous approach to identifying critical inclination segments in a pipeline that can potentially be affected by internal corrosion, and a real-time monitoring-based methodology to inspect, monitor and provide remediation as needed. The methodology of existing ICDA framework powered with advanced flow and corrosion prediction models and best in class monitoring solutions provides three significant and concrete benefits to pipeline operators:
(a) Ability to perform characterization of pipelines in terms of potential for corrosion damage and determination of critical areas that require physical inspection with the use of advanced flow and corrosion prediction models.
(b) Ability to assess the health of the entire pipeline by performing inspections on selected critical areas of the pipeline inline with existing NACE standards.
(c) Ability to view and assess the status of the critical areas in real-time with the application of monitoring technology coupled with real-time data processing.
Corrosion Prediction Model
Presence of an aqueous electrolyte like water, though necessary, is not a sufficient condition for internal corrosion damage to occur. Further, other operating characteristics of the environment, such as pH, gas composition, pressure and temperature have a significant impact on potential for corrosion. Although the presence of liquid water provides a necessary medium for corrosion, the actual parametric conditions and composition of the transmitted gas and the amount of the water present, define the extent of corrosion.
CO2-based corrosion has been one of the most active areas of research in corrosion, with several predictive models for carbon steel corrosion assessment. For the development of any corrosivity model, it is important to recognize the role of superposition of various parameters involved. Such recognition not only requires a clear understanding of independent parameter effects, but also entails the knowledge of how the corrosion rate is affected when subjected to the simultaneous effects of two or more variables.
The Predict™ corrosion model (Corrosion Prediction Model) which addresses CO2/H2S corrosion, incorporates the effect of various parameters such as: system pH, 16 different anionic and cationic species, FeCO3 and FeS saturation and scaling, oxygen, hydrocarbon persistence, momentum transfer and water phase behavior.
This Corrosion Prediction Model seamlessly integrates the effects of system thermodynamics and phase equilibrium, ionic electro-chemistry, fluid dynamics and metallurgy to form a comprehensive corrosion prediction tool. This comprehensive predictive model is built upon substantial thermodynamic analyses and numerical data, and has also been evaluated in the context of a real life case study.
Two Case Studies
The case studies here are part of the ICDA analysis for a major pipeline in the U.S. Historical and operational data analysis and GPS Data for line profiling and mapping was handled by an inspection partner company. Flow modeling and line profiling was undertaken to assess potential for water hold up and corrosion in the line and to quantify corrosivity in segments operating above the critical inclination angle with an available aqueous electro-chemical environment.
Based on the transmission data provided, Case 1 was set up for 8 MMscf/d of gas transmission at 83.7 psia, 60 ºF to assess the effect of any liquid carryover in the pipeline, which had been noted to have occurred in the past. Pipeline ID of 11.8 inches and a worst case CO2 concentration of 1.68 mole percent was used. The total pipeline was mapped to generate an elevation vs. distance profile which was imported into the software as an MS-Excel file. This section of the pipeline ran a total of 286,125 feet and the analysis of a stretch of 8,925 feet has been presented here in Case 1. As shown in Figure 2, the line is free of any critical segments and the corresponding computed critical angle determined to be 2.06 degrees.
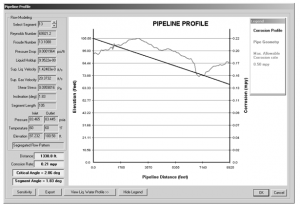
Figure 2: Pipeline Profile Results Screen for Case 1.
Case 2 was set up for a section of the pipeline farther downstream with 13.95 MMscf/d at 155.5 psia and 60 ºF. The elevation data for this section was also similarly imported into the program, the analysis of a stretch of 16,485 feet, has been presented here in Case 2. Critical angle computed under these operating conditions was found to be in the range of 3.26 degrees and three critical segments with greater inclinations were identified (Figure 3). The line characterization under conditions of liquid carryover points to a worst case corrosion rate of up to 18.5 mils per year.

Figure 3: Pipeline Profile Results Screen for Case 2.
Conclusions
The Advanced-ICDA model described here is built around an existing ICDA framework, and incorporates industry leading technology and proven modeling and monitoring systems. It provides pipeline operators compelling benefits, such as the ability to easily identify critical areas, so as to develop efficient inspection programs for pipeline condition assessment and monitor potential for internal corrosion damage in these critical segments through real-time monitoring. The Advanced-ICDA methodology provides a comprehensive framework to minimize cost of operating pipeline inspection programs, and concurrently, develop safe pipeline operating procedures in a pro-active manner.
Acknowledgements
The authors would like to acknowledge the contributions of Gary White, President, PI Confluence, Inc., in generating field case study data to demonstrate the efficacy of the proposed methodology.
The authors

Sridhar Srinivasan, senior engineering manager at Honeywell, manages all aspects of corrosion modeling and development for the company. He has an extensive track record of developing innovative corrosion engineering models for the oil/gas/pipeline industry. He has more than 20 years of industry experience and holds a master of science degree in mechanical engineering from the University of Houston. Contact him care of David Ratz,
952-346-6334, dratz@webershandwick.com.
Vishal Lagad, senior engineer at Honeywell, works in design and development of applications for corrosion prediction and material selection in both upstream and downstream applications. His key contributions have been in flow modeling, water phase behavior, pipeline profiling, numerical interpolation and corrosion modeling. He has seven years of experience and holds a master of science degree in chemical engineering from TAMU-K. Contact him care of David Ratz, 952-346-6334, dratz@webershandwick.com.
References
Oliver Moghissi, et. al., “Internal Corrosion Direct Assessment of Gas Transmission Pipelines”, Paper No. 02087, Corrosion/02, Denver, Colorado, April 2002.
Matt Schmidt, “Practical Applications of the Internal Corrosion Direct Assessment Process for Natural Gas Pipelines”, Paper No. 03189, Corrosion/03, San Diego, CA March 2003.
V. Lagad, S. Srinivasan, and R. Kane, “Software System for Automating Internal Corrosion Direct Assessment of Pipelines”, Paper No. 04197, Corrosion/04, New Orleans, April 2004
C. S. Fang et al., “Computer model of a gas condensate well containing carbon dioxide”, Corrosion/89, Paper 465, New Orleans, NACE, 1989.
C. de Waard and U. Lotz, “Prediction of CO2 corrosion of carbon steel”, Corrosion/93, Paper 69, New Orleans, 1993.
L. H. Gatzky and R. H. Hausler “A novel correlation of tubing corrosion rates and gas production rates ”, Advances in CO2 Corrosion, Vol. 1, pp. 87, NACE 1984.
Srinivasan S. and R. D. Kane, “Critical Issues in the Application and Evaluation of a Corrosion Prediction Model for Oil and Gas Systems”, Paper No. 03640, Corrosion/03, San Diego, CA, March 2003.
R.D. Kane, D.A. Eden, D.C. Eden, “Online, Real-time Corrosion Monitoring for Improving Pipeline Integrity – Technology and Experience”, Paper No. 03175, Corrosion/03, San Diego, CA, March 2003.
V. Lagad, S. Srinivasan, and R. Kane, “Software System for Automating Internal Corrosion Direct Assessment of Pipelines”, Paper No. 04197, Corrosion/04, New Orleans, April 2004.

Comments