
January 2020, Vol. 247, No. 1
Features
AI Use in Improving Product Quality, Operational Processes
By Ian Burgess, Chief Technical Officer, Validere
Artificial intelligence (AI) will be one of the most transformative technologies for business in the next 10 years. Early demonstrations of the power of AI in speech recognition and autonomous driving should remove those doubts.
An increasingly important application for AI in oil and gas is product quality since it governs what crude is worth and where it can be delivered. What is often described as a uniform commodity has a range of qualities that affect the products that can be produced from it, and how easy the refining process is.
Measuring product qualities remains difficult to measure accurately and in real-time. It’s a daunting task for the industry as product moves quickly and mixes constantly, irreversibly changing the product quality. The result is that industry participants are often buying and selling a product, and transporting it, without full insight into what exactly they have. This creates inefficiencies across the supply chain, since the right products aren’t getting to the end markets best suited for them, costing all participants both time and money.
This article highlights two case studies showing how AI technology can be applied to increase netbacks at a midstream terminal facility by several dollars per barrel via the optimization of operational decision making related to crude quality.

Case 1: Gathering System
Poor knowledge of product quality exposes a number of risks to a business. The first is mispricing – either overpaying for a product that has poorer quality than expected or being underpaid for high-quality product. The second is poor quality management, resulting in lost revenue as oil is blended and aggregated throughout the supply chain.
When two batches of crude oil are mixed together, the resulting mixture may have a higher or lower price than the sum of the original components. This is true for most liquid commodities. Since the principle of entropy makes blending an essentially irreversible process, the blended crude really is a completely new product with different properties from the original feedstocks.
Furthermore, the value of a barrel of crude cannot be simply derived from adding up the value of all its molecular components. Even for contaminants that are considered universally to be of low value (such as Vanadium), crude prices per barrel generally do not vary strictly linearly with contaminant concentration. More commonly, crude prices are defined according to grades that specify a range of acceptable quality parameters.
The range is usually defined narrowly enough that refiners can benefit from a fairly consistent product from batch to batch. However, defining specifications too narrow can cause the market to lose liquidity as products meeting specifications become scarcer.
For example, West Texas Intermediate (WTI) traded on the New York Mercantile Exchange (NYMEX) must have a density between 37 and 42 API, and a sulphur content less than 0.42%wt. For some trades, there is an additional equalization premium or penalty applied based on how the quality parameters of a given batch vary within the allowed range.
As soon as the continuum of possible crude quality is broken into grades with differing liquidity in the market, the variation of the price of crude with quality is bound to exhibit nonlinear behavior, such as step changes in value at grade boundaries (Figure 1).
Anytime the price of crude varies non-linearly with a quality parameter, knowledge of that quality parameter and management of quality through blending has a significant impact on the bottom line. The highest value is derived from keeping the value of quality parameters close to grade boundaries.
For example, suppose two 10,000-bbl batches are purchased, one with 0.35%wt sulphur and the other with 0.55%wt sulphur (assume all other specifications are the same). The first meets the WTI specifications, but the second does not. As a result, the second batch can only be sold at a discount compared to WTI. However, if the batches are combined before selling, they can be sold together as WTI (0.4%wt sulphur). Combining the two batches adds liquidity to the market, leading to a profit.
Now consider the case where in which the two 10,000-bbl batches of have a sulphur content of 0.35%wt and 0.85%wt, respectively (all other specifications the same). Now if the batches are combined, the new blend will have a sulphur content of 0.6%wt, above the WTI specification. Selling this blend leads to a loss as a result of losing access to the WTI market. However, a profit can still be made if a small amount of the sour crude is added into the sweeter crude, increasing the sulphur content of the blend, but not enough to take it outside the WTI spec limit.
Maximal profit is made if just enough heavy crude is added to get as close to the specification limit as possible without going over. This ensures that the largest possible volume is added to the WTI pool. However, if too much is added, all the crude is now off-spec and the liquidity and value decrease considerably as a result.
Figure 2 shows how the overall per-barrel value of the inventory varies by the sulphur content in the blended batch. From the shape of this curve, it is apparent that there is a significant financial premium on how accurately the sulphur content of crude is known at all times.
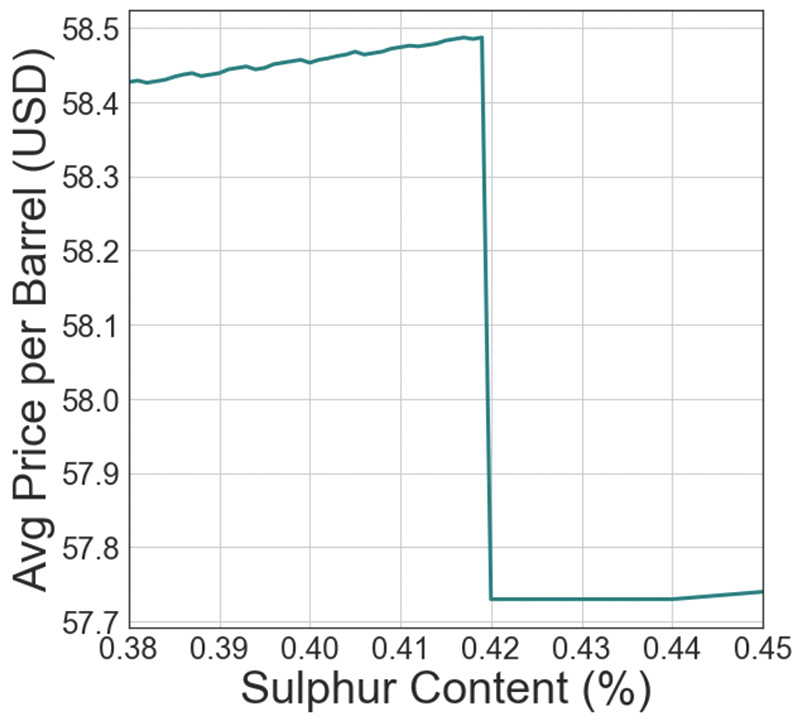
Since the premium for blending incrementally closer to the spec limit (about $0.10/bbl for every additional 0.05%wt) is dwarfed by the penalty from going over it ($0.80/bbl), the optimal strategy for quality management is to allow for a buffer between the value of the quality parameter targeted by the blend and the actual optimal value right at the spec limit. This buffer should be equal to the uncertainty in your quality, which is determined by the uncertainty in your quality testing program.
Modern data visualization tools and AI improve the efficiency of this process in two ways:
First, they enable the use of facility data to quantify the uncertainty in quality derived from the facility’s processes. It is valuable to quantify uncertainty because without a systematic understanding of the actual quality variability compared to projections, acting based on a very conservative guess – a certain overestimation – is the prudent way to avoid off-specification incidents. With properly quantified uncertainty, process adjustments can be made to improve profit without increasing risk of off-specification shipments.
Second, AI can help identify which steps of the process are producing uncertainty. This knowledge allows for the most efficient investment of capital and effort to reduce uncertainty and increase the value of the barrels derived from quality optimization.
Case Study
At a midstream company, Validere used algorithms to continuously analyze facility data in order to optimize the sampling schedule at a gathering terminal managing 10 incoming streams with differing sulphur content.
The terminal operator had access to historical lab data from each stream as well as analytical information provided by the shippers. However, the variability of daily arriving batches from the historical average created uncertainty in the overall sulphur content of the tank. This uncertainty must be accounted for when ensuring that the outgoing streams meet pipeline specifications for sweet crude as they are blended downstream. As described, this uncertainty carries significant financial implications.
A spot sampling program for incoming batches can reduce this uncertainty, but each test ordered adds additional costs for operators’ time and lab analysis costs. Therefore, Validere’s goal was to design a testing schedule that reduced uncertainty in the estimation of the blended sulphur content in the tank, while minimizing the investment in analysis.
Given the constraint of the maximum number of tests the operator is able to run in one day, Validere’s algorithm recommended whether or not a given incoming batch should be tested when it arrived, using historical test data as a basis for analysis. To illustrate how much of an improvement could be realized from this type of recommendation engine, one month’s operations were simulated 1,000 times, randomizing the arrival time of incoming batches, to determine the impact of an optimized testing schedule.
Figure 3 shows how the maximum daily uncertainty in the sulphur content of the sales tank over the month varied with the number of tests run per day (averaged over 1,000 simulated months). The maximum daily uncertainty is more important than the average uncertainty because it is the tolerance that must be accommodated on all blends to avoid any off-spec incident in a month.

The algorithm-optimized testing schedule is compared to a random sampling program. As expected, both programs can reduce the uncertainty to arbitrarily low levels with sufficient effort. However, the optimized sampling program takes significantly less effort to achieve the same results. For example, it took 40% less effort to reduce the uncertainty by 50% compared to no sampling.
Case 2: Scheduling optimization
Traders and schedulers usually take the quality of scheduled incoming and outgoing streams into account when planning the operations of a terminal for an upcoming month. Whether acting on their own behalf as a single shipper, or acting on behalf of their clients, they have an incentive to optimize the quality of the crude as it passes through their facility.
In making optimization calculations, they can estimate the quality of the product that arrives using historical values or lab results provided by the supplier. However, it is common in many basins for the quality of incoming product to vary significantly from expectations. For example, suppose a shipment that was supposed to meet the WTI specification is delivered off-specification.
The options for handling this situation are to blend the batch with another batch that can bring the total back into spec, sell the off-spec shipment to someone who can take it at a discount, or treat it.
Integrating AI into trading, scheduling and operations allows for day-to-day split second operational decisions to be made with the same level of diligence as a major acquisition, incorporating estimates of the uncertainty of the quality measurements and probabilistic predictions for the quality of future batches that might affect the decision. Applying this level of diligence to every operational decision and can significantly improve the performance and profitability of the operation.
Case Study
To optimize the scheduling at a truck terminal in North America, Validere built a simulation to make rapid operational decisions. The simulation makes decisions by leveraging nominations and measurement data of volume and density. The terminal, having two storage tanks with a capacity of just under 2,000 barrels, receives incoming shipments covering a wide range of densities and delivers into two pipeline-connected streams downstream (light sweet crude and condensate).
The key quality parameter dividing the two streams is density. The two key day-to-day operator decisions studied were which tank to put a given truckload into when it arrives, and when to empty the tanks. The two streams trade at different prices downstream, each with additional equalization credits/penalties for variations in density within the allowed specification.
The key constraints to the optimization are:
- The impact of the density on the value of each crude stream is calculated based on a monthly volume-weighted average measured by a composite sample sent to a third-party lab.
- All individual shipments must meet the pipeline specification limits for crude and condensate, as verified by on-line densitometers.
- No tank can be filled past 100% capacity. Once full, tanks must be emptied before accepting a new load.
- The quality of incoming shipments is measured as each arrives via an on-line densitometer. The only other quality information the terminal has for the densities of incoming streams is an annual third-party lab result provided by the supplier.
To predict most probable density values and expected variability for each incoming stream, the model uses historical records from the on-line densitometer and annual third-party samples. Once the densitometer starts measuring the density of a new truckload, the model makes a decision on which tank to unload the truck into using knowledge of what is already in each tank, the average density and volume of each outgoing stream shipped in the month to date, and probabilistic projections of the product density in future trucks that will come in during the month.
Figure 4 shows the simulated improvement to terminal revenues made possible through this approach. The AI-directed offloading protocol (blue) was compared to the default practice at the facility, which was to place all incoming truckloads in the crude density range into the crude tank and all incoming truckloads in the condensate density range in the condensate tank.
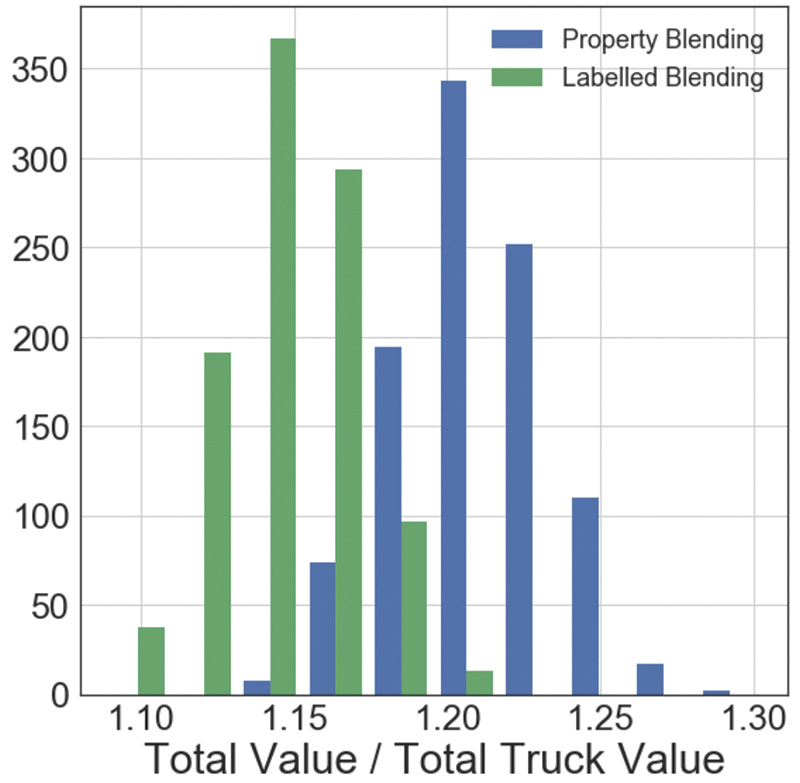
In addition, considering the actual sequence of truck arrival, Figure 4 shows simulated financial outcomes of thousands of randomized alternative arrival sequences of incoming trucks. These additional simulations measure the sensitivity of the AI protocol’s success to chance.
The average revenue increase for the terminal was about 5% of the crude value or about $3.50 per barrel. The width of each distribution shows the impact of the remaining uncertainty on the performance of the blend.
Like human statisticians, AI does not promise to remove all uncertainty from a given process and replace it with sure outcomes. It merely helps quantify that uncertainty and predict a course of action that is most likely to give the best outcome.
Author: Ian Burgess is the co-founder and CTO of Validere, an organization bridging human and artificial intelligence to improve oil and gas operations. He received a doctorate in applied physics from Harvard in 2012 and a bachelor’s degree in mathematical physics from the University of Waterloo, Ontario, Canada, in 2008.

Comments