
August 2012, Vol. 239 No. 8
Features
Measurement Of Roof Topping Effects As An Integral Part Of Routine In-Line Inspection
Caused by improper crimping of the steel sheet in the production process, roof topping is a geometric anomaly that occurs along the longitudinal seam weld of the pipe. These incorrectly crimped sheets then result in a deviation from the perfectly circular geometry of the pipeline. The implications of roof topping for pipeline integrity are severe. They include risk of failure during hydro-testing or fatigue failure during pipeline operation.
Whereas the roof topping effect has so far typically been assessed using a profile gauge to take an angle measurement manually from the outside of the pipe, a high resolution geometry tool now enables automatic measurement of all joints from the inside as part of routine In-Line Inspection. Providing 100 % coverage, this tool measures and plots the radius at each point of the pipe, so that any deviation from the ideal circle is detected immediately. The maximum deviation is then used to calculate the roof topping angle. This paper discusses the nature of the measurement method, relevant experience gained in the field, and the degree of accuracy achieved with this high resolution geometry technology.
Introduction
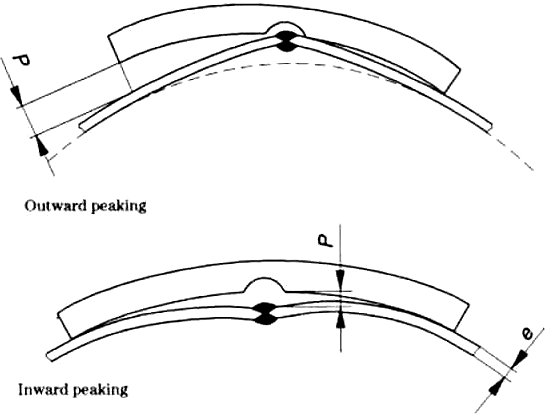
Roof topping (also referred to as pipe peaking) is defined as a non-circular geometric anomaly that occurs along the longitudinal seam weld of pipelines (Boothby, 2009). This effect is more commonly found in, but by no means limited to, older pipes. As part of the manufacturing process of longitudinal pipes, the plate edges are crimped before final welding. If crimping is done incorrectly, this can result in a departure from the perfectly circular geometry of the pipe when the edges of the plates are welded together. A distinction is made between positive (i.e., outward pipe peaking) and negative (i.e., inward pipe peaking) roof topping (see Figure 1).
Excessive peaking resulting from incorrectly crimped sheets can lead to cracking or splitting along the longitudinal weld in the cold expansion stage of the manufacturing process. It is not surprising, therefore, that roof topping can have profound and far-reaching effects on pipeline integrity. These notably include the risk of failure during hydro-testing and even fatigue failure during pipeline operation. As such, they pose a serious threat to the environment. Where the effects of roof topping coincide with ovality, the stress concentration factor is further exacerbated. The conventional approach to assessing the roof topping effect has been to use profile gauge to take an angle measurements manually from the outside of the pipe (Figure 1).
A fresh approach to the challenge of measuring roof topping
A resolution geometry tool is now available which takes a fresh approach to the challenge of gauging roof topping: it enables automatic measurement of all joints from the inside as part of routine In-Line Inspection. Combining the benefits of two sensor planes with the advantages of a mechanical caliper arm with touchless high resolution distance measurement, this high resolution geometry tool provides highly accurate geometry data on the internal contour of the pipeline (Figure 2).

Figure 2: High Resolution Geometry Tool (RoGeo•Xt, developed by ROSEN). The tool incorporates two sensor planes for full coverage under all operational conditions.
In addition to the two sensor planes shown above (Figure 2), the hybrid technology of the RoGeo•Xt also makes use of a mechanical caliper arm (Figure 3). Monitoring of the mechanical position of this caliper arm in combination with a touchless distance measurement means that this system can be used under highly dynamic operational conditions such as high tool velocities. Moreover, the strength of this mechatronic system is that scale or wax debris, although detected by the system, does not affect the geometry evaluation of the pipeline.
Because it incorporates two sensor planes and a caliper arm with touchless distance measurement, the High Resolution Geometry Tool not only provides 100% coverage of the internal wall, but, most importantly, higher data accuracy and a wider operational range of the system. The tool is therefore capable of accurately measuring the radius at each point along the pipe. Since all values are plotted, any deviation from the ideal circle is detected immediately. The maximum deviation is then used to calculate the roof topping angle.

Figure 3: A conventional mechanical caliper device (ß) is supported by a high-resolution touchless proximity sensor (?) for increased measurement reliability and accuracy.
A further advantage of the High Resolution Geometry Tool is that it can easily be combined with other tried and tested technologies such as high-resolution Magnetic Flux Leakage (MFL). As a result, more of the repair conditions as outlined in the regulations can be covered in a single run. For pipeline operators, this means that reduced production flow for the purpose of inspection is minimized [Steffen Paeper et al., 2006].
Putting the new approach to the test
Where it is not possible to measure a pipe peaking angle directly from the inside, simple geometric relations and compensation algorithms are used to calculate the angle on the basis of the data collected by the High Resolution Geometry Tool. An example is angle ? in Figure 4.

Figure 4: Simplified relation between measurement components and output properties are used to calculate angle ?.
In this case, the absolute pipe peaking value x is derived from a robust automated algorithm. On the basis of this algorithm, a supplementary chart is generated (Figure 5). The maximum aberration is displayed in relation to the mean joint radius (blue curve) and the original long seam position. Additionally, an ovality fit (pink curve) is calculated and displayed which helps discriminate between inward and outward peaking. The ovality, as an additional deliverable, supports further assessment calculations.

Figure 5: Cross section chart showing outward pipe peaking.
RoGeo•Xt data can alternatively be displayed as a line plot with a color scan in the background (Figure 6). The color blue color represents ID enlargement, whereas red indicates ID reduction. The example given shows clear outward peaking at the long seam position. The resulting angle is 27.6°.

Figure 6: Line plot with color representation generated on the basis of inspection data collected with the High Resolution Geometry Tool. The example shows outward pipe peaking.
In general, the maximum deviation measured at the long seam provides a reasonable estimation of absolute pipe peaking. However, this absolute value is also affected by additional factors, notably:
• the simplification of the principal shape of outward peaking or inward flattening
• the exact position of the eddy current sensor in relation to the weld root
• the thickness of the weld root
These effects are taken into account in the calculations in order to maximize the accuracy of the resulting pipe peaking value x. Field verifications have confirmed the expected accuracy. Table 1 compares the maximum angles of field investigated joints with the angles calculated on the basis of RoGeo•Xt data.

Table 1: Comparison between values calculated on the basis of RoGeo•Xt data and actual field measurements.
The absolute accuracy of the RoGeo•Xt tool amounts to 0.8 mm with 80 % certainty. This level of accuracy satisfies typical measurement requirements for roof topping effects such as 0.005 D and 2.5 mm [DNV, 2008].
Conclusion
The development of a new approach to the measurement of roof topping means that such deformation no longer has to be measured manually. Detailed comparisons between deviation values calculated on the basis of inspection data gathered with the High Resolution Geometry Tool and actual field measurements show the effectiveness of the hybrid approach to measuring roof topping effects. Not only is the tool able to detect such anomalies, but they can be differentiated and quantified along the long seam on the one hand, and in terms of overall ovality of the pipe circumference on the other. Most importantly, the measured results comply with the detection threshold and quantification accuracy requirements typically used in the industry.
Resulting as it does in fitness-for-purpose-relevant deformation of the long seam in the form of either inward or outward peaking, roof topping poses a considerable threat to pipeline integrity. In view of this threat, the development of a system that can measure this geometric anomaly accurately, reliably and automatically during normal In-Line Inspection routines constitutes an important step forward.
Acknowledgements
The authors would like to thank all people involved in this project for their contribution, especially MACAW, Martijn Beuvink and Kees Witziers for their support.
References
[1] Peter Boothby: Roof Topping Note, ROSEN / MACAW internal communication, p. 1 – 4, December 2009
[2] DNV Offshore Standard DNV-OS-F101. sec. 7, p. 83, October 2007
[3] Steffen Paeper, Thomas Beuker, Bryce Brown: The Geometry Sensor, World Pipelines, November 2006

Comments