
July 2011, Vol. 238 No. 7
Features
How Todays Gas Ultrasonic Meter Handles Compressor Pulsations
To date, limited testing has been done to determine the effects pulsation in the gas stream may have on the ultrasonic meter’s accuracy and performance. Some previous testing does show that there may be an impact on accuracy when the frequency of the pulsation is the same as — or a multiple of — the sampling frequency of the ultrasonic meter.
To more clearly understand the pulsation impact, Sick Maihak, Inc. sponsored tests conducted at the TransCanada Pipe Line Didsbury Gas Dynamic Test Facility (GDTF). The results shown in this article are for an NPS 8 – inch FLOWSIC600 4 + 1 meter, also known as the 2plex design. A series of flow rates, frequency of pulsations, and pulsation amplitudes were generated downstream of the meter. The accuracy of the ultrasonic meter was determined by comparison to sonic nozzles that are located upstream of the pulsation source in such a manner so as to be unaffected by the pulsations being generated.
Installation
The meter used for the testing was the 2plex (or 4+1) which consists of a 4-path and single-path meter within the same meter body. The electronics for each of the meters is independent, and there is no communication between the two.
The transducers for the fiscal 4-path meter are located in the traditional Westinghouse configuration. The single path meter transverses the meter at the center of the meter body, the most profile-sensitive measurement position of the meter. Due to this, a difference in volumes between the single path and the fiscal 4-path occurs when the velocity profile changes. That is, the single-path meter is far more sensitive to flow disturbances than the 4-path meter design.
An additional benefit of using this meter design is that the single path meter can sample and process up to 75 samples per second (SPS) while the 4-path is limited to approximately 25 SPS due to the additional processing associated with the four paths.
Didsbury Test Facility
The Didsbury test facility uses a bank of 24 sonic nozzles located upstream of the test section in order to control and measure the flow rate. The facility generally operates between 700-880 psig and between 40-60 degrees F. Maximum capacity (flow velocity) for an 8-inch meter is approximately 50 feet per second (fps). The Didsbury Test Facility stated uncertainty is on the order of ±0.2%.
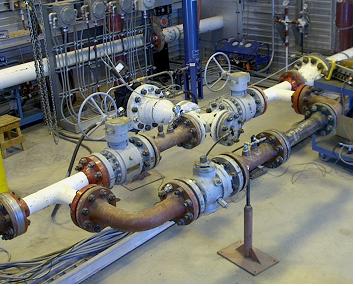
The FLOWSIC600 8-inch 2plex meter was installed between the reference nozzle bank and the high pressure pulsation generator (HPPG). The upstream piping included 10D + CPA + 10D + meter and 5D downstream for the thermowells. The high-pressure pulsation generator (HPPG) unit is constructed of NPS 4-inch piping components that consists of a porous paddle mounted inside a pipe cross. This is a device developed by Nova Chemical that was initially used for some pulsation testing in the early 2000s for a consortium called METCON. Figure 1 is a picture of the HPPG and associated bypass valve. These are located in the building that is downstream of the meter under test.
The pulsation generator is capable of varying both the frequency of pulsations and the amplitude. The rotation speed of the paddle wheel controls the pulsation frequency while the amount of bypass through the parallel valve controls the amplitude. The paddle is rotated through the use of a hydraulic motor that is installed inside of the housing.
Test Conditions
Based on previous testing and calculations it was determined that 8, 15 and 23 Hz frequencies provided maximum pulsation velocity amplitudes at this meter location. An additional point at 12 Hz was added to duplicate previous testing pulsation frequencies.
The pulsation testing was conducted at two primary flow rates, 15 and 28 fps. Five levels of pulsation amplitude, recorded as pressure waves in kPa, were used. They were approximately 5, 8, 15, 20 and 30 kPa. At the higher flow rate and frequency the amplitude was limited so most testing was performed between 5 and 20 kPa (0.73 and 2.90 psi) amplitude for both flow rates.
It was also decided to vary the sample rate of the 4-path meter to see if there was any benefit in sampling at something other than the default sample rate of 10 samples per second (SPS) from the factory. The tests were performed with the meter set to 10, 15, 20 and 25 SPS. At the end of the tests it was determined that the meter was unable to achieve the 25 SPS. Therefore, testing results are shown only for 10, 15 and 20 SPS. Although the results from the single-path meter are not discussed herein, it was fixed at 75 SPS.
Baseline Testing And Verification
Prior to running the tests to determine the effects of pulsation, an “As Found” calibration was performed to determine the baseline for each of the meters. Also, to ensure the stability of the test system, the baseline test (no pulsation) was repeated after each series of pulsation tests. The variance of the 4-path meter was within ±0.08%, indicating a high level of confidence that any shift in meter error is attributable to the induced pulsation and not meter drift.
With no pulsation present, the review of the meter diagnostics indicated an average turbulence level of 3.25% for all paths of the 4-path meter and a very stable velocity.
Preliminary Tests
A set of preliminary tests was run to observe the effect of high level (HL) pulsation on the meter. With a gas velocity of 15 fps, pulsation frequency at 10 Hz and maximum pulsation amplitude of about 30 kPa, tests were run with the meter set for 10 SPS. Figure 2 shows graphs of the velocity for each path under no pulsation and a high level of pulsation.

Figure 2: 4-path meter – High level pulsation and meter sample rate.
With the high level pulsation present, the meter’s velocity readings show very significant variances. This clearly indicates that frequency and the magnitude of the pulsation is having an effect on the velocity readings.
Error Results
Error tests were run at the frequencies that had been determined to create maximum pulsation velocity amplitudes for this configuration. For each frequency and pulsation level the 4-path meter was tested at sample rate settings of 10, 15, 20 and 25 SPS. Log files were collected at each of the test conditions for evaluation of the meter diagnostics at each of the test conditions.
Figure 3 shows the range of errors (deviation from baseline) generated from the meter for a flow velocity of 15 fps at all four meter sampling frequencies (SPS) and both the low- and high-level pulsations that were tested.

Figure 3: 4-Path Meter Error at 15 fps, Low and High Pulsation, All Sampling Intervals.
At a sample rate of 10 SPS the error at all pulsation frequencies was within about ±0.5%. At the higher sample rates of 15, 20 and 25 SPS the error had an increasing trend to a maximum of approximately 1.5%.
Contrary to the belief that sampling at a rate higher than the natural frequency of the pulsation will reduce meter error, the factory default sample rate of 10 SPS produced the best results for all tests. These results show that there is more than one way to improve meter performance in pulsating environments. Figure 4 shows the same graph as in Figure 3 but for a velocity of 28 fps.

Figure 4: 4-Path Meter Error at 28 fps, Low and High Pulsation, All Sampling Intervals.
At the higher gas velocity of 28 fps, the meter error is about the same as the 15 fps at 10 SPS for both low and high levels of pulsation. At the higher sample rates of 15, 20 and 25 SPS, the error was lower suggesting that higher velocities may reduce the meter error due to pulsation for these sample rates.
Meter Diagnostics
While the pulsation test results provide valuable information with respect to some interactions between the pulsation characteristics and the meter sample rate, it doesn’t provide a definitive way of identifying pulsation. The meter’s built-in diagnostics do provide this information.
Pulsation creates a wave within the flowing gas stream which the meter diagnostics detect as variability in velocity. This is more commonly known as turbulence. The magnitude of the turbulence may be dependent on the frequency and amplitude of the pulsation and the meter’s sampling rate for the transit time.
From meter log files collected during each test, the turbulence indicated by the meter diagnostics for one series of tests are shown in Figure 5. The charts show the turbulence at all sample rates, for both high level (HL) and low level (LL) pulsation, are quite high when compared to the base with no pulsations.

Figure 5: Turbulence Due to Pulsation as Indicated by Meter Diagnostics.
Figure 5 shows that the turbulence increases from 3-4% with no pulsation up to 20% with LL pulsation and 50% with HL pulsation. A blocked flow conditioner, or swirl caused by absence of a flow conditioner, would not cause these high levels of turbulence. Although liquids flowing at the bottom of the pipe could cause such levels, they would only be present on path 4.
Real World Field Application
While the Didsbury testing utilized extreme levels of pulsation, a real world application presented itself in 2010. The customer’s installation consisted of a reciprocating compressor station with four inlet and outlet orifice meters. The inlet gas was at 155 psig and 75 degrees F while the outlet was about 410 psig and 80 degrees F.
A Square Root Error Indicator (SREI) was used to identify the presence of pulsation. It showed levels that exceeded 10%. Through the use of lower Beta ratios on the orifice, the SREI values were reduced to around 1%. However, this increased the permanent pressure loss across the station thereby increasing fuel costs. With a typical imbalance across the station exceeding 5%, an alternative solution was needed. Figure 6 shows a typical monthly balance chart for the orifice metering.

Figure 6: Daily Station Balance using Orifice Meters – One Month.
Based on the results from the Didsbury testing, indications were that the USM could work accurately in this situation and solve the imbalance problem. Two calibrated 4-path meters were installed; a 4-inch at the inlet and a 3-inch at the outlet. Each meter was supplied with the typical 10D + CPA + 10D piping upstream. Figure 7 shows a typical monthly balance chart across the station for the ultrasonic meter.

Figure 7: Daily Station Balance using USM Meters – One Month.
The imbalance went from an average of +6.74% with orifice metering to -0.33% with the ultrasonic meters. Certainly the average difference (LUAF) for the USM is well within the expected uncertainty of a metering facility when considering the primary element as well as all secondary measurement equipment.
The average turbulence for all four paths of the inlet meter, which was operating at 155 psig, was 50.6%. It was obtained from a periodic maintenance report by the local technician. This is a very high level of turbulence; one that would not normally be seen in the field if it were not for the severe pulsations created by the reciprocating compressor just downstream of the meter. Even with this high level of turbulence, the impact on its accuracy was insignificant.
Average turbulence for all four paths of the outlet meter was 9.2%. It was operating at around 410 psig. This level is still higher than normal, but one that might be seen in the field if a reciprocating compressor was near the meter.
Conclusions
The results obtained from this series of tests indicate that it is difficult to predict the effect pulsation will have on the meter simply by looking at the diagnostics. The pulsation frequency and amplitude, meter sample rate and gas velocity all have an influence on the magnitude of error introduced by the pulsation.
Based on the analysis of these tests, it was observed that there was only one combination of pulsation frequency and pulsation amplitude at the lower velocity that created an error of greater than 0.5% and that was the 23 Hz high level (HL) test. Even with this very severe level of pulsation, when the meter was sampling at 10 samples per second (SPS), the deviation from baseline (when no pulsation existed) was within 0.5%. At the 15 fps flow velocity the worst error observed was at a sample rate of 15 and a pulsation frequency of 15 Hz.
The important thing to note is the meter’s performance (deviation from baseline), under all levels of pulsation and all frequencies of pulsation, performed best when the meter was sampling at the lower frequency of 10 Hz. This may be a bit of a surprise as many feel the faster the meter samples the flow stream, the lower the potential affect on the meter’s accuracy. However, this shows the opposite result in this case and thus it is clear there is more than one way to minimize the effect pulsation has on the meter’s accuracy.
The meters’ diagnostics, especially turbulence, indicate it is significantly affected when pulsations exist. Identifying the presence of pulsations is very easy using these internal diagnostic tools.
The real-world application showed that the level of pulsation generated by the reciprocating compressors was high, but it did not affect this meter like it did the orifice meter. Differences in balance were in excess of +6% when using orifice measurement, but were on the order of -0.3% when using ultrasonic meters. This supports the test data from the Didsbury test facility and shows that flow during typical levels of pulsation in the field can be measured accurately with a 4-path ultrasonic meter sampling at 10 samples per second.
Acknowledgement
This article is based on a presentation at the 2011 American Gas Association Operations Conference & Exhibition in Nashville, TN.
Author
John Lansing holds the post of Global Director of Flow Technologies for Sick Maihak, Inc. He is based in Houston. His experience includes 26 years with Southern California Gas, three plus years with Instromet and seven plus years with Daniel prior to joining Sick in January. 2006. He earned a bachelor’s degree in mechanical engineering from California Polytechnic University in 1982.

Comments