
February 2010 Vol. 237 No. 2
Features
Station Configuration Impacts Availability, Fuel Consumption and Pipeline Capacity-Part 2 Of 2
The number of compressors installed in each compressor station of a pipeline system has a significant impact on the availability, fuel consumption and capacity of the system. Depending on the load profile of the pipeline, the answers may look different for different applications.
Among the factors to be considered is the fact that gas turbines can produce a significant amount of additional power at lower ambient temperatures. So, even for constant load of the pipeline, the relative load of the driver changes, and thus influences fuel consumption and pipeline capacity. Part 1 of this two-part article covered the more general thoughts. Part 2 discusses the application of these principles to an actual situation.
Central Asian Pipeline
For our case study, we considered a long-distance pipeline in Central Asia. The total length of the trunkline is about 7,000 km. The pipeline consists of two 42-inch parallel lines which turn into a single 48-inch line when it crosses the border. The pipeline design throughput is 30 billion m3 per year (Bcm/y) and maximum operating pressure of this pipeline is 9.8 MPa. There are 10 compressor stations planned in one area, and more than 20 stations in the receiving country. After first gas, it takes five years to build up to full capacity.
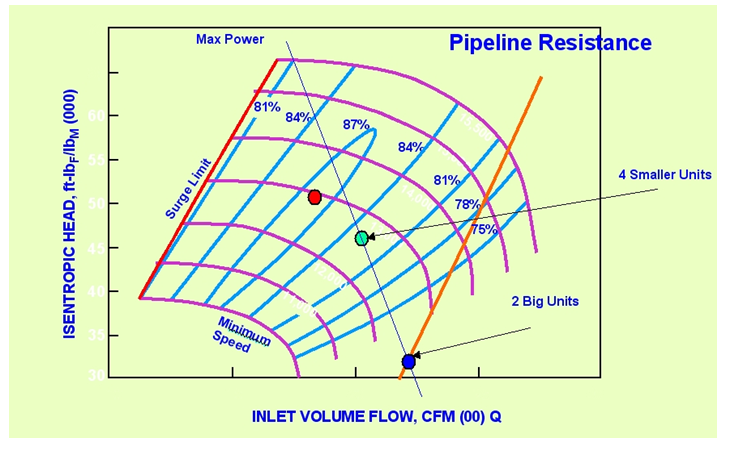
When we compare operations of the compressor station, we need to recognize two main approaches. We can assume either operation with fewer large turbocompressor units (Case A, two large units), or with a greater number of smaller turbocompressor units (Case B, four small units).
The following factors need to be considered when selection of either setup is decided. In evaluating the system reliability and maximum throughput, a failure analysis needs to be performed. If we were to consider two large 30-MW units the failure of one of them will result in 50% reduction of power available whereas if we consider four smaller 15-MW units, the failure of one of them will result in only a 25% power reduction. Figure 7 outlines the basic fact that, if the surviving units run at full load to make up as much flow as possible, the operating point for the Case B will be close to the highest efficiency island so the remaining online compressors will be working more effectively compared to Case A, when the single remaining large unit will be working in the stonewall area. It is obvious that pipeline recovery time will be shorter in case B.
Based on an analysis by Santos (2006), Case A can represent even more problems. The amount of gas that the single remaining 30-MW unit will have to process is so large that it will put this remaining unit into choke, and thus for practical purposes, out of operation. The amount of fuel that the remaining unit is going to burn will not justify that negligible increase in head that this unit will provide. So, practically, when one larger turbocompressor will be out of operation, the second will have to be shutdown and the station will be bypassed. Station configurations with the single oversize driver and either no standby or standby on each second or third station are often advocated. The arguments in favor of this method are very high pipeline availability (99.5%) and high efficiency (40-42%) of the larger 30-MW turbocompressor units. In fact, designing for a turbine oversized by 15% will lead to normal operations at part-load conditions almost all the time (99.5%) where there will be negative impact on turbine efficiency and, as a result, increased fuel consumption.
Another negative impact of this approach is that normally this pipeline would operate at lower than MAOP pressure, whereas the highest operational pipeline pressure produces less pressure losses and, therefore, lower requirements for the recompression power. The reason for that is the maintenance schedule for the turbocompressors on the stations with the single units without standby. In order to perform maintenance on these units, the pipeline linepack will have to be maximized up to MAOP, so that unit can be taken off line and the pipeline throughput will not be affected. Therefore, the normal pipeline operations have to be based on a lower MAOP.
Also worth mentioning is the pipeline capacity when considering the single turbocompressor approach. At the current conditions in Central Asia, for example, many of the pipelines transport gas owned and produced by different commercial entities. As such, the gas field’s development time and gas availability depends on many technological and, lately, political factors that may potentially have a negative impact on pipeline-predicted capacity growth. In these conditions, the single oversized turbocompressor will either be working into deep recycling mode until the expected amount of gas will become available or start operation with smaller capacity compressor stages, which will subsequently need a costly change of the internal bundle.
Fuel Comparison
It is increasingly important to evaluate all seasonal conditions when making a comparison between two different station layout cases. For the pipeline in this case study, different design organizations were involved in the pipeline feasibility study. One of them has used summer conditions only and came to the conclusion that larger turbines are the preferred option. Another source used annual average conditions and came to the opposite conclusion. The reason for that was that during the winter, fall, and spring months, which cover a total of nine out of 12 months of operation, one of the smaller turbocompressors was put into the standby mode.
Due to lower ambient temperature, the amount of power available from the remaining three units was enough to cover the 100% duties due to high compressor efficiency. This was not true for the Case 1 (based on the same explanation above) and both 30 MW-units had to work in the deep part load with unsatisfactory turbine efficiency. The fact that operational mode became 3+2 for Case B gave additional benefits worth mentioning. Since two turbocompressors were in standby mode, there was an opportunity to do all maintenance work at this time of year. It means that availability of this system becomes superior as compared to Case A, especially if we were to consider operations in the summer months.
Maintenance And Overhauls
Another advantage of operating only three out of five units for a significant part of the year (i.e. nine out of 12 months) is the extended time between overhauls. Based on the calculations below, the total number of hours for each turbocompressor unit per year was reduced from 7,008 to 5,694 and, therefore, the time between overhauls could be extended. Based on a 4+1 unit of operation during three summer months and 3+2 units operating during the rest of the year (nine months), if the units were used so that they all ran exactly the same number of hours each year, each unit would run for 5,694 hours every year. Whereas if we account for four working units with one standby throughout the year, the number of working hours will be as follows: 8,760 x 4 units running = 35,040/5 units available = 7,008 total hours per unit/year.
Note that all units run for an equal number of hours to make the calculation simple. However, the customer could push lead machines to reach the agreed TBO first, so that all engines do not come up for overhaul at the same time. This would help with the overhaul cost by helping to distribute the overhaul cost over the 30-year cycle.
We can even take it a step further and see additional benefits of this approach. Accounting for the normal year-around operation with four units online, each turbocompressor will get 7,008 x 30 year = 210,240 required hours of operations. Whereas considering a 3+2 setup for nine months, the total number of required hours of operations is reduced to 170,820 hours. With modern turbines technology, it is not uncommon to see that lifetime operation reaches 150-180,000 hours. That means, for the lifetime of this project (30 years) there will be no need to buy a new set of equipment. This alone makes a huge favorable impact on the project’s economics.
Station Versus System Availability
It is important to recognize the difference between station and pipeline availability since misunderstanding of this issue can lead to the wrong conclusion. The station availability calculations are easy, straightforward and based on simple statistical equation. It is easy to see that the smaller number of units on a single compressor station will yield higher availability. But is this true for the entire pipeline system? The answer is not easy and requires additional investigation, including extensive hydrodynamic analysis using statistical methodology. As was pointed out in recent papers, the Monte Carlo method (Santos, 2009) proved to be the good methodology to determine pipeline system availability. The statistical portion consists of generating multiple random cases of equipment failure on single or two consecutive compressor stations. The hydrodynamic portion will calculate the maximum throughput that pipeline is available to carry when these failures occur.
Based on this extensive and in-depth analysis, it can be shown that availability of a pipeline configured with smaller multiple units delivers better overall results. The main reason for that outcome is that shutdown of the smaller unit makes lesser impact on the behavior of the entire pipeline. Of course, to have fair results, the availability of the single turbocompressor unit, either smaller 15 MW or larger size 30 MW was identical. It is easy to understand that in our particular case the availability of the station setup with smaller units (case B) was greatly enhanced because of the presence of an extra standby unit during winter, fall and spring months when stations setup has 3+2 configuration.
Effect Of Large Unit Shutdown
Examples of the vulnerabilities are demonstrated based on a typical pipeline scenario with four stations. Each station has two compressor trains without spares. If one unit in station 2 is lost, the pipeline flow is reduced by 12%. However, the same 12% flow reduction can be maintained by also shutting down the surviving unit in station 2. This is due to the necessarily inefficient operation of the surviving unit in station 2, which is forced to operate in choke. If both units are shut down, stations 3 and 4 will be able to recover the flow, but at a much higher overall efficiency. Thus, shutting both units down reduces the pipeline fuel consumption compared to the scenario with only one unit shut down in station 2.
The point of this example is that the failure of one of two large units in a compressor station has more significant consequences than the failure of a smaller unit in a station with three or more operating units. In other words, scenarios with three or more units per station without spare units tend to have a higher flow if one of the units fails, or has to be shut down for maintenance, than scenarios with two units per station without spare units.
Conclusions
Figure 8 summarizes the findings. One of the key differences is due to the large range of ambient temperatures in this application. This allows operators to shut one of the smaller units down for significant periods of time, while in the 2+1 configuration with larger units, it is not possible to shut down one unit because the remaining single unit cannot handle the entire duty due to being in choke area (Figure 8). This subsequently leads to the following differences that impact the cost structure of the project:
1. Fuel consumption will be less as smaller units will operate much closer to the full load.
2. As one unit is not needed in the solution with smaller units, all maintenance work can be done during the winter, spring and fall months, thus significantly increasing the availability of the pipeline system. At this point we need to compare availability of single compressor stations and entire pipeline system availability.
3. The time between overhauls will be extended and as a result the Station OPEX and CAPEX (due to longer service life) will be reduced.

Figure 8: Cost Comparison.
Additionally, as the pipeline will grow by phases, the smaller units can accommodate actual pipeline growth and be installed when necessary. In addition to the projected design phases of the pipeline capacity growth, there is a big uncertainty that this plan will be followed as sources of the gas are from different suppliers, which can potentially change their earlier commitments.
Authors
Matt Lubomirsky is Senior Consultant, Systems Analysis at Solar Turbines Incorporated in San Diego, CA. He is responsible for predicting gas turbine and compressor performance and for conducting application studies that involve pipeline and compressor station modeling. He attended the Leningrad Institute of Technology in Saint Petersburg, Russia where he received a master’s degree in mechanical engineering. He has authored numerous articles about turbomachinery related topics.
Rainer Kurz is the Manager, Systems Analysis at Solar Turbines Incorporated in San Diego, CA. His organization is responsible for predicting compressor and gas turbine performance, for conducting application studies, and for field performance testing. Dr. Kurz attended the Universitaet der Bundeswehr in Hamburg Germany, where he received the degree of a Dr.-Ing. in 1991. He has authored numerous articles about turbomachinery related topics and is an ASME fellow.
Pavel Klimov is First Deputy General Director of Intergas Central Asia in the Republic of Kazakhstan. He graduated from Uralsk University and Saratov Technical University and has PhD degree in science. Dr. Klimov is responsible for operations and maintenance of the entire gas pipeline system in Kazakhstan.
Saeid Mokhatab is an internationally recognized expert in the field of natural gas engineering with a particular emphasis on raw gas transmission and processing. He has been involved as a technical consultant in several international gas-engineering projects and published more than 150 academic and industry oriented papers on related topics. He can be contacted at saeid_mokhatab@hotmail.com.
References
1. Kurz, R., and Brun, K., “Gas Turbine Performance-What Makes the Map,” paper presented at the 29th Texas A&M Turbomachinery Symposium, Houston, TX, USA (Sept. 18-21, 2000).
2. Kurz, R., and Cave, M., “Compressors and Compressor Control,” Hydrocarbon Engineering, 5, 9 (2000).
3. Kurz, R., and Mokhatab, S., “Considerations on Compressor Station Layout,” Pipeline & Gas Journal, 234, 9, 22-26 (Sept. 2007).
4. Lotton, J.H., and Lubomirsky, M., “Gas Turbine Driver Sizing and Related Considerations,” Bratislava (2004).
5. Mohitpour, M., Golshan, H., and Murray, A., “Pipeline Design and Construction: A Practical Approach,” ASME Publication, New York, NY, USA (2000).
6. Ohanian, S., and Kurz, R., “Series or Parallel Arrangement in a Two-Unit Compressor Station,” ASME Journal of Engineering for Gas Turbines and Power, 124, 4, 936-941 (2002).
Santos, S.P., “Transient Analysis- A Must in Gas Pipeline Design,” paper presented at the 1997 Pipeline Simulation Interest Group Conference, Arizona, USA (1997).
7. Santos, S.P., Bittencourt, M.A.S., and Vasconcellos, L.D., 2006, “Compressor Availability –Managing its effects on Pipeline Operation,” paper presented at the 6th International Pipeline Conference, Calgary, AB, Canada (Sept. 25-29, 2006).
8. Santos, S.P., “Monte Carlo Simulation- A Key for a Feasible Pipeline Design,” paper presented at the 2009 Pipeline Simulation Interest Group Conference, Galveston, TX, USA (May 12-15, 2009).

Comments