
August 2009 Vol. 236 No. 8
Features
Device Maps Centerline And Wall Details Of Live Pipelines
This article provides a brief overview of an innovative, inertial-based smart probe technology that can map the centerline of pipelines of a wide range of diameters, configurations and operating pressures.
The device, called a smart probe, obtains XYZ centerline mapping, bend radius, internal angle and misalignments or deformation data for most pipelines — newly installed, live or shut down. Accurate pipeline location and trajectory, along with bend characterization, are important data in regulatory compliance and essential in creating or validating GIS systems.
The data that is collected via the smart probe is not only quantifiable (correlation to as-built documentation) but is also a qualitative check of all geometric and condition data sets. Smart probe data can be utilized to aid owners, engineers, designers and contractors in identifying, mapping, and planning for the management and integrity of pipeline assets.
Geospatial Corporation’s technology approach offers the pipeline operator flexibility and low impact to acquire an accurate 3D centerline. It can be coupled with cleaning and maintenance operations resulting in tangible downstream savings by creating and/or validating existing location data.
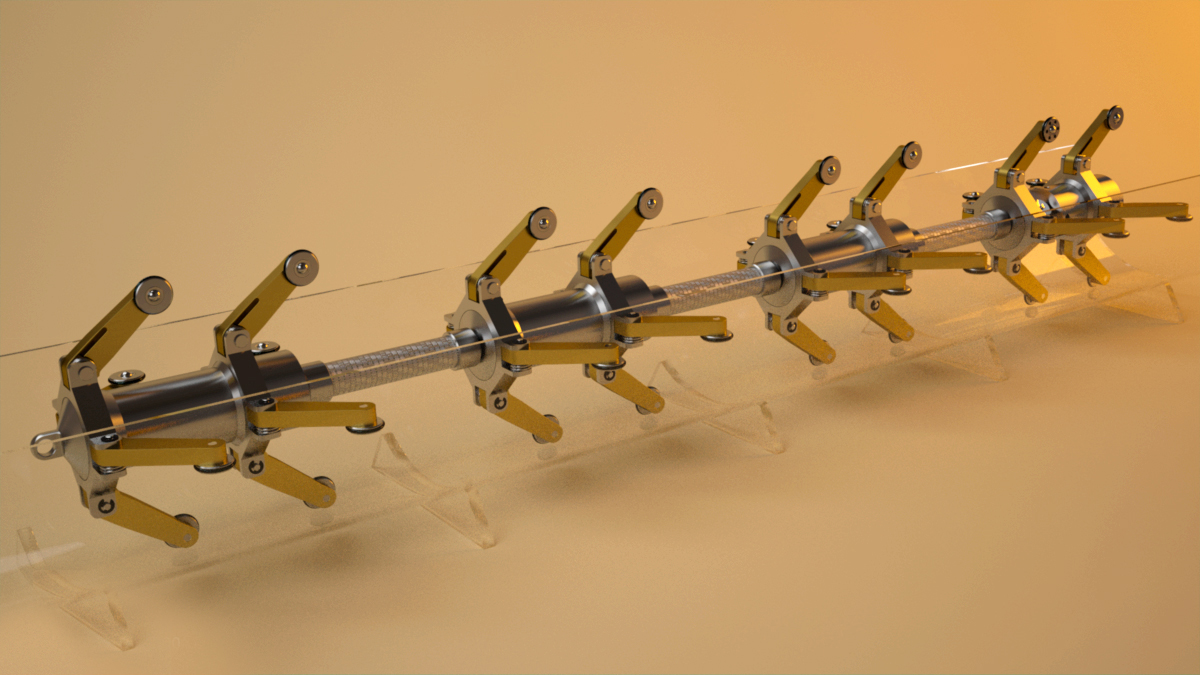
The Technology
The smart probe technology consists of two main components. The first is an array of data collection instruments which includes accelerometers, gyroscopes and odometers contained within each of the probe bodies. The second is a post-mission software package which extracts, computes, and interprets the collected data and allows for the seamless transfer of the collected information into various GIS databases.
As the smart probe moves through the pipeline it records all changes in inclination, heading and velocity at 800 Hz, and stores the information internally. Once launched into the operating pipeline, the probe collects data autonomously as with most ILI tools and typical tracking and above-ground marker (AGM) operations are carried out.

The smart probe operates in a relative coordinate frame, measuring a continuous centerline 3D trajectory. Registering and correcting the probe is achieved by launch, trap, and above-ground marker tracking stations surveyed along the pipeline route using precise GPS methods (+/-0.10m accuracy). This provides the absolute XYZ pipeline positions in any datum or coordinate system worldwide. By transferring the complete pipe centerline into CAD or a GIS database, accurate XYZ registration creates the baseline or validation of the true location of the infrastructure asset.
A key goal in developing the smart probe technology was to design the instrumentation in such a way that it is capable of being utilized within a series of different probe body styles that would allow for the use of the technology within the widest range of pipeline types, sizes and environments. To this end, the initial instrumentation was miniaturized with a goal of developing a smart probe capable of operating within a 3.8 cm (1.5 inch) diameter pipeline. An articulating body on this probe allows for movement through a pipeline with as small as a 43.18-cm (17-inch) radius bend.
To map larger diameter pipelines, the same data collection instrumentation and software are utilized, and the probe bodies are modified to enable movement through the pipeline while still allowing the probe to track the pipeline centerline. Depending on the pipeline interior surface and condition, various wheel-sets with protruding carrier legs are used to assure the positioning of the probe body within the pipe.
The ability to economically design and develop multiple specifications for the smart probe bodies or carriers and utilize the same instrumentation modules is a key element to the smart probe technology. Modifying the probe bodies allows operations in high pressure, high temperature and many caustic environments. Key design factors are the articulation of the carrier bodies to negotiate tight radius bends and diameter restrictions (or changes), as well as light weight and low friction / pressure differential — all considerations to reduce operator impact of the survey.
The basic smart probe is designed for use within non-pressurized pipeline environments. Second generation smart probes have been designed for use in pressurized environments up to 6.55 bar (95 psi).
High Pressure Use
The newest high-pressure smart probes have been designed primarily for the oil and gas industry and are capable of operating in environments up to 241 bar (3,500 psi) with battery and memory capacities allowing for very long distance runs. These probes will be available in mid-2009.
Limitations on length of run are strictly dependent on battery and memory life and each probe can be modified to increase these components as needed. This flexibility provides the opportunity to service a broad range of underground utility markets.
Data Output
As introduced, the probe collects data at 800 Hz as the probe moves through the pipeline. The stored data is downloaded immediately after trapping the tool, and validated for completeness and performance. The field technician sends the data via the internet to a centralized, secure access server to be processed. Depending on the needs of the client, the data can be provided in one of several formats ranging from intricate detail of each of the data points to a summary report providing a simple CAD plan and profile view of the pipeline run. Data can be provided in a format which integrates with all current GIS platforms.
The primary deliverable is a complete spatial register of the pipeline position at client specified intervals, typically +/- 0.01m. The register also contains feature tagging of girth welds and any other internal features detectable (e.g., block valves, bends, miters, misalignments, tees). This facilitates downstream integration of other assessment technologies such as MFL, UT, Caliper, etc.
The smart probes are either tethered or propelled through the pipeline. The most common method of using a probe to map utility pipelines that are accessible on both ends of a section of interest is to insert a pull rope through the pipeline, attach the probe to the pull rope and utilize a winch to pull the probe through the pipeline. This has been done for lengths up to 4 km (2.48 mi).
For pressurized lines that need to stay in service or for much longer pipe runs, the smart probes are attached to pigs (typically foam) and they are pushed through the pipeline with either compressed air, water or the pipeline product itself. This provides operational flexibility.
Accuracy
The smart probes are designed to be extremely accurate although all gyroscopically-based instruments are subject to errors. In order to control these errors, project plans are developed to include GPS corrections using above-ground marker locations. It was important to understand any potential deviation and to develop specified tolerances that could be used as a safe guide when evaluating the completed pipeline mapping data.
The probes produce data accurate to 0.25% of the distance between two known coordinates on the “X & Y” horizontal plane (plan view) and within 0.10% of the distance between known points on the “Z” vertical plane (depth). This translates to 1:400 horizontal, and 1:1000 vertical. These estimates are based purely on the accuracy of the odometer (velocity), however, the use of above-ground marker locations at 1-2 km (0.62 – 1.2 mi) spacing along the pipeline extends the accuracy to 1:1000 horizontal, and 1:2000 vertical. The odometer still remains as the most critical element for location and deriving positions from ILI tools.
Applications
The smart probe technology allows pipeline owners, operators and engineers to obtain accurate and economical centerline data from most types of underground and above ground pipelines and serve that data into all CAD and GIS software databases.
For both existing pipelines and new construction, the smart probe technology is an efficient method to create accurate as-built pipeline drawings. The integration of this centerline data into powerful GIS databases is a compelling addition to all pipeline asset management programs.
The smart probe technology also proves effective in obtaining accurate as-built drawings from pipelines installed via horizontal directional drilling. Not only is the accurate centerline mapped, but the software is capable of calculating the actual installed bending radius at every point along the pipeline. By overlaying the smart probe’s centerline data with existing grade information, depth of cover above the pipeline is established.
With data from the smart probe, all pipeline joints whether welded joints, ring joints or gasketed slip joints, are easily detectable and assigned a coordinate. By reviewing the output data, the quality of certain joints can be reviewed and any improperly installed offset joints can be discovered.
The autonomous nature of the technology allows the smart probes to be easily “coupled” with most other pipeline assessment tools and to very efficiently add important positioning capabilities. Video cameras, leak detection equipment, sonar and laser evaluation tools, as well as MFL, UT, and Caliper tools can be added in tandem to the smart probe for multiple assessment tasks.
Conclusions
The smart probe technology provides a methodology to obtain accurate XYZ centerline mapping, bend radius, internal angle and misalignments or deformation data for most pipelines, live or shutdown.
The data collected not only is quantifiable (correlation to as-built documentation) but is also a qualitative check by indicating internal pipeline misalignments or deformations. The data can help owners, engineers, designers and contractors to identify, map and plan for management of the integrity of pipeline assets.
The approach offers operators flexibility and low impact to acquire an accurate 3D centerline. Coupled with cleaning and maintenance operations, it can economically create or validate existing location data.
Acknowledgement
This article was derived from a paper, “Innovative Technology to Identify, Map and Plan for the Management and Integrity of Pipeline Assets,” presented at the 7th International Pipeline Conference in Calgary, Alberta, IPC2008-64604, sponsored by ASME. The paper was written by Mark Smith, Linda Ward and Todd Porter. Todd Porter and Linda Ward presented the paper at the conference.
The authors:
Todd R. Porter is Executive Vice President of Geospatial Corporation, 20333 SH 249, Suite 200, Houston, TX 77070, 281-378-1522, tporter@geospatialcorporation.com
Linda M. Ward is Executive Vice President, Business Development, of Geospatial Corporation, 3556 Piedmont Rd. NE Suite 409, Atlanta, GA 30305, 412-298-8195, lward@geospatialcorporation.com.
Bibliography
Federal Register 49 CFR, Part 195, Pipeline Safety: Pipeline Integrity Management in High Consequence Areas (Hazardous Liquid Operators With 500 or more miles of Pipeline); Final Rule
Federal Register 49 CFR Part 192, Pipeline Safety: Pipeline Integrity Management in High Consequence Areas (Gas Transmission Pipelines); Final Rule
ASME B31.8S-2001, Managing System Integrity of Gas Pipelines
API Standard 1160 Managing System Integrity for Hazardous Liquid Pipelines, November 2001
Pipeline Research Council International, Inc. (PRCI), 1600 Wilson Blvd., Arlington, VA, USA, 22209
Muhlbauer, K.M. (2003) Pipeline Risk Management Manual – Ideas, Techniques, and Resources, Third Edition, Gulf Professional Publishing

Comments